SQL Server 2008 Reporting Services Charting - adding a data table to bottom of a chart
Posted
by Christopherous 5000
on Stack Overflow
See other posts from Stack Overflow
or by Christopherous 5000
Published on 2010-04-05T18:39:51Z
Indexed on
2010/04/05
18:43 UTC
Read the original article
Hit count: 308
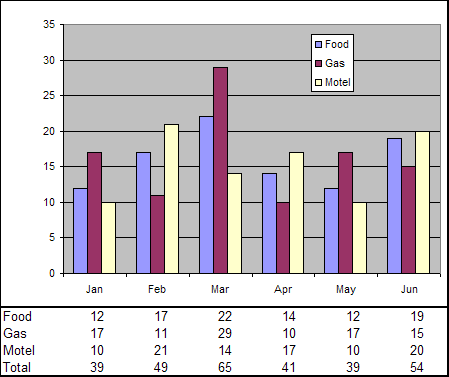
I would like to add a data table to bottom of a (line) chart in a report. I know I can create a matrix report with the same data source. I would like to have everything lineup automatically like it does when you add a data table to a chart in Excel (as shown at http://www.tushar-mehta.com/excel/newsgroups/data_table/).
Example from Excel (from above link)

Any ideas?
© Stack Overflow or respective owner