Curve fitting: Find a CDF (or any function) that satisfies a list of constraints.
Posted
by dreeves
on Stack Overflow
See other posts from Stack Overflow
or by dreeves
Published on 2010-04-23T22:52:22Z
Indexed on
2010/04/23
22:53 UTC
Read the original article
Hit count: 385
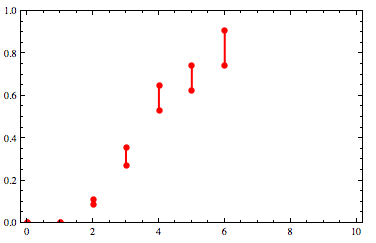
I have some constraints on a CDF in the form of a list of x-values and for each x-value, a pair of y-values that the CDF must lie between. We can represent that as a list of {x,y1,y2} triples such as
constraints = {{0, 0, 0}, {1, 0.00311936, 0.00416369}, {2, 0.0847077, 0.109064},
 {3, 0.272142, 0.354692}, {4, 0.53198, 0.646113}, {5, 0.623413, 0.743102},
 {6, 0.744714, 0.905966}}
Graphically that looks like this:

And since this is a CDF there's an additional implicit constraint of
{Infinity, 1, 1}
Ie, the function must never exceed 1. Also, it must be monotone.
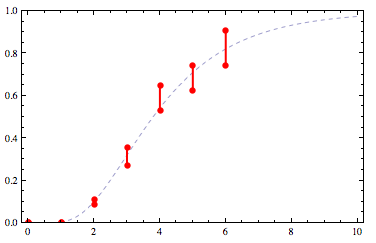
Now, without making any assumptions about its functional form, we want to find a curve that respects those constraints. For example:

(I cheated to get that one: I actually started with a nice log-normal distribution and then generated fake constraints based on it.)
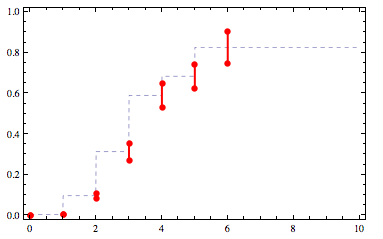
One possibility is a straight interpolation through the midpoints of the constraints:
mids = ({#1, Mean[{#2,#3}]}&) @@@ constraints
f = Interpolation[mids, InterpolationOrder->0]
Plotted, f looks like this:

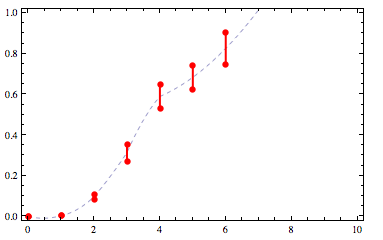
That sort of technically satisfies the constraints but it needs smoothing. We can increase the interpolation order but now it violates the implicit constraints (always less than one, and monotone):

How can I get a curve that looks as much like the first one above as possible? Note that NonLinearModelFit with a LogNormalDistribution will do the trick in this example but is insufficiently general as sometimes there will sometimes not exist a log-normal distribution satisfying the constraints.
© Stack Overflow or respective owner