West Wind WebSurge - an easy way to Load Test Web Applications
Posted
by Rick Strahl
on West-Wind
See other posts from West-Wind
or by Rick Strahl
Published on Tue, 15 Jul 2014 09:06:55 GMT
Indexed on
2014/08/18
16:24 UTC
Read the original article
Hit count: 1567
ASP.NET
A few months ago on a project the subject of load testing came up. We were having some serious issues with a Web application that would start spewing SQL lock errors under somewhat heavy load. These sort of errors can be tough to catch, precisely because they only occur under load and not during typical development testing. To replicate this error more reliably we needed to put a load on the application and run it for a while before these SQL errors would flare up.
It’s been a while since I’d looked at load testing tools, so I spent a bit of time looking at different tools and frankly didn’t really find anything that was a good fit. A lot of tools were either a pain to use, didn’t have the basic features I needed, or are extravagantly expensive. In the end I got frustrated enough to build an initially small custom load test solution that then morphed into a more generic library, then gained a console front end and eventually turned into a full blown Web load testing tool that is now called West Wind WebSurge.
I got seriously frustrated looking for tools every time I needed some quick and dirty load testing for an application. If my aim is to just put an application under heavy enough load to find a scalability problem in code, or to simply try and push an application to its limits on the hardware it’s running I shouldn’t have to have to struggle to set up tests. It should be easy enough to get going in a few minutes, so that the testing can be set up quickly so that it can be done on a regular basis without a lot of hassle. And that was the goal when I started to build out my initial custom load tester into a more widely usable tool.
If you’re in a hurry and you want to check it out, you can find more information and download links here:
- West Wind WebSurge Product Page
- Walk through Video
- Download link (zip)
- Install from Chocolatey
- Source on GitHub
For a more detailed discussion of the why’s and how’s and some background continue reading.
How did I get here?
When I started out on this path, I wasn’t planning on building a tool like this myself – but I got frustrated enough looking at what’s out there to think that I can do better than what’s available for the most common simple load testing scenarios.
When we ran into the SQL lock problems I mentioned, I started looking around what’s available for Web load testing solutions that would work for our whole team which consisted of a few developers and a couple of IT guys both of which needed to be able to run the tests. It had been a while since I looked at tools and I figured that by now there should be some good solutions out there, but as it turns out I didn’t really find anything that fit our relatively simple needs without costing an arm and a leg…
I spent the better part of a day installing and trying various load testing tools and to be frank most of them were either terrible at what they do, incredibly unfriendly to use, used some terminology I couldn’t even parse, or were extremely expensive (and I mean in the ‘sell your liver’ range of expensive). Pick your poison. There are also a number of online solutions for load testing and they actually looked more promising, but those wouldn’t work well for our scenario as the application is running inside of a private VPN with no outside access into the VPN. Most of those online solutions also ended up being very pricey as well – presumably because of the bandwidth required to test over the open Web can be enormous.
When I asked around on Twitter what people were using– I got mostly… crickets. Several people mentioned Visual Studio Load Test, and most other suggestions pointed to online solutions. I did get a bunch of responses though with people asking to let them know what I found – apparently I’m not alone when it comes to finding load testing tools that are effective and easy to use.
As to Visual Studio, the higher end skus of Visual Studio and the test edition include a Web load testing tool, which is quite powerful, but there are a number of issues with that: First it’s tied to Visual Studio so it’s not very portable – you need a VS install. I also find the test setup and terminology used by the VS test runner extremely confusing. Heck, it’s complicated enough that there’s even a Pluralsight course on using the Visual Studio Web test from Steve Smith. And of course you need to have one of the high end Visual Studio Skus, and those are mucho Dinero ($$$) – just for the load testing that’s rarely an option.
Some of the tools are ultra extensive and let you run analysis tools on the target serves which is useful, but in most cases – just plain overkill and only distracts from what I tend to be ultimately interested in: Reproducing problems that occur at high load, and finding the upper limits and ‘what if’ scenarios as load is ramped up increasingly against a site. Yes it’s useful to have Web app instrumentation, but often that’s not what you’re interested in.
I still fondly remember early days of Web testing when Microsoft had the WAST (Web Application Stress Tool) tool, which was rather simple – and also somewhat limited – but easily allowed you to create stress tests very quickly. It had some serious limitations (mainly that it didn’t work with SSL), but the idea behind it was excellent: Create tests quickly and easily and provide a decent engine to run it locally with minimal setup. You could get set up and run tests within a few minutes. Unfortunately, that tool died a quiet death as so many of Microsoft’s tools that probably were built by an intern and then abandoned, even though there was a lot of potential and it was actually fairly widely used. Eventually the tools was no longer downloadable and now it simply doesn’t work anymore on higher end hardware.
West Wind Web Surge – Making Load Testing Quick and Easy
So I ended up creating West Wind WebSurge out of rebellious frustration…
The goal of WebSurge is to make it drop dead simple to create load tests. It’s super easy to capture sessions either using the built in capture tool (big props to Eric Lawrence, Telerik and FiddlerCore which made that piece a snap), using the full version of Fiddler and exporting sessions, or by manually or programmatically creating text files based on plain HTTP headers to create requests.
I’ve been using this tool for 4 months now on a regular basis on various projects as a reality check for performance and scalability and it’s worked extremely well for finding small performance issues. I also use it regularly as a simple URL tester, as it allows me to quickly enter a URL plus headers and content and test that URL and its results along with the ability to easily save one or more of those URLs.
A few weeks back I made a walk through video that goes over most of the features of WebSurge in some detail:
Note that the UI has slightly changed since then, so there are some UI improvements. Most notably the test results screen has been updated recently to a different layout and to provide more information about each URL in a session at a glance.
The video and the main WebSurge site has a lot of info of basic operations. For the rest of this post I’ll talk about a few deeper aspects that may be of interest while also giving a glance at how WebSurge works.
Session Capturing
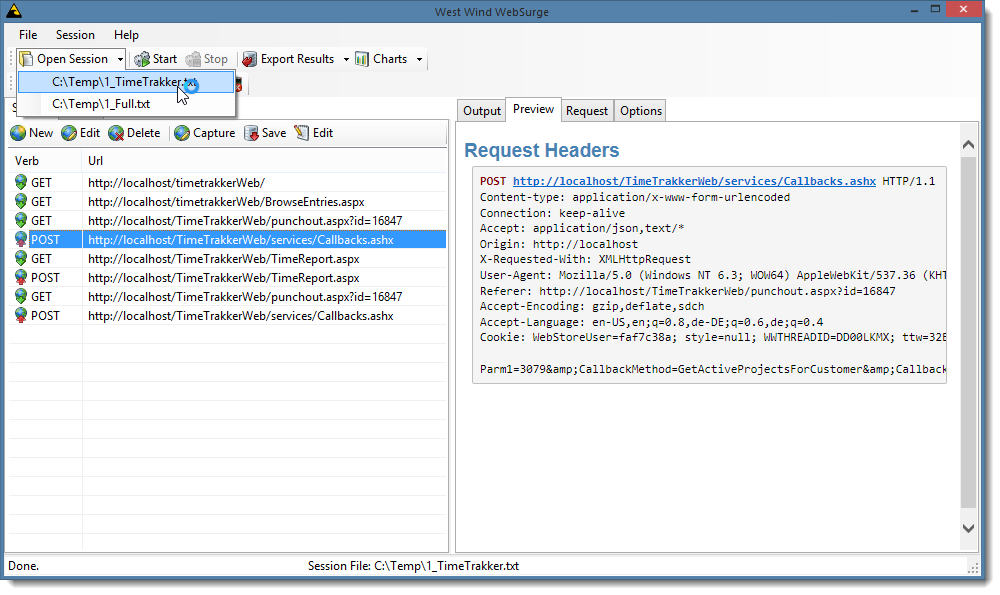
As you would expect, WebSurge works with Sessions of Urls that are played back under load. Here’s what the main Session View looks like:
You can create session entries manually by individually adding URLs to test (on the Request tab on the right) and saving them, or you can capture output from Web Browsers, Windows Desktop applications that call services, your own applications using the built in Capture tool.

With this tool you can capture anything HTTP -SSL requests and content from Web pages, AJAX calls, SOAP or REST services – again anything that uses Windows or .NET HTTP APIs. Behind the scenes the capture tool uses FiddlerCore so basically anything you can capture with Fiddler you can also capture with Web Surge Session capture tool. Alternately you can actually use Fiddler as well, and then export the captured Fiddler trace to a file, which can then be imported into WebSurge. This is a nice way to let somebody capture session without having to actually install WebSurge or for your customers to provide an exact playback scenario for a given set of URLs that cause a problem perhaps.
Note that not all applications work with Fiddler’s proxy unless you configure a proxy. For example, .NET Web applications that make HTTP calls usually don’t show up in Fiddler by default. For those .NET applications you can explicitly override proxy settings to capture those requests to service calls.
The capture tool also has handy optional filters that allow you to filter by domain, to help block out noise that you typically don’t want to include in your requests. For example, if your pages include links to CDNs, or Google Analytics or social links you typically don’t want to include those in your load test, so by capturing just from a specific domain you are guaranteed content from only that one domain. Additionally you can provide url filters in the configuration file – filters allow to provide filter strings that if contained in a url will cause requests to be ignored. Again this is useful if you don’t filter by domain but you want to filter out things like static image, css and script files etc. Often you’re not interested in the load characteristics of these static and usually cached resources as they just add noise to tests and often skew the overall url performance results. In my testing I tend to care only about my dynamic requests.
SSL Captures require Fiddler
Note, that in order to capture SSL requests you’ll have to install the Fiddler’s SSL certificate. The easiest way to do this is to install Fiddler and use its SSL configuration options to get the certificate into the local certificate store. There’s a document on the Telerik site that provides the exact steps to get SSL captures to work with Fiddler and therefore with WebSurge.
Session Storage
A group of URLs entered or captured make up a Session. Sessions can be saved and restored easily as they use a very simple text format that simply stored on disk. The format is slightly customized HTTP header traces separated by a separator line. The headers are standard HTTP headers except that the full URL instead of just the domain relative path is stored as part of the 1st HTTP header line for easier parsing.
Because it’s just text and uses the same format that Fiddler uses for exports, it’s super easy to create Sessions by hand manually or under program control writing out to a simple text file. You can see what this format looks like in the Capture window figure above – the raw captured format is also what’s stored to disk and what WebSurge parses from.
The only ‘custom’ part of these headers is that 1st line contains the full URL instead of the domain relative path and Host: header. The rest of each header are just plain standard HTTP headers with each individual URL isolated by a separator line. The format used here also uses what Fiddler produces for exports, so it’s easy to exchange or view data either in Fiddler or WebSurge.
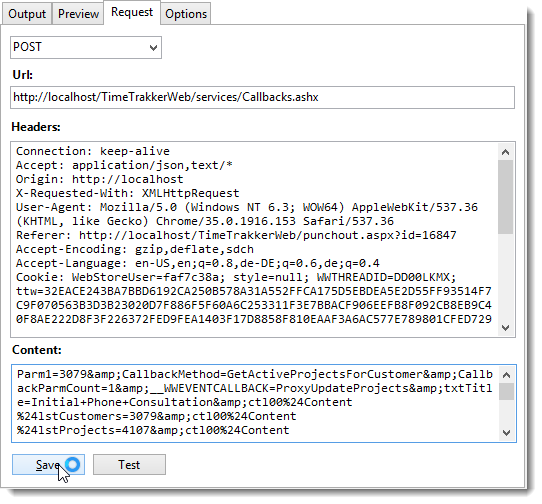
Urls can also be edited interactively so you can modify the headers easily as well:
Again – it’s just plain HTTP headers so anything you can do with HTTP can be added here.
Use it for single URL Testing
Incidentally I’ve also found this form as an excellent way to test and replay individual URLs for simple non-load testing purposes. Because you can capture a single or many URLs and store them on disk, this also provides a nice HTTP playground where you can record URLs with their headers, and fire them one at a time or as a session and see results immediately. It’s actually an easy way for REST presentations and I find the simple UI flow actually easier than using Fiddler natively.
Finally you can save one or more URLs as a session for later retrieval. I’m using this more and more for simple URL checks.
Overriding Cookies and Domains
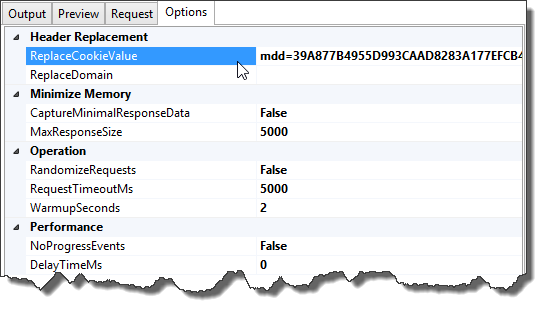
Speaking of HTTP headers – you can also overwrite cookies used as part of the options. One thing that happens with modern Web applications is that you have session cookies in use for authorization. These cookies tend to expire at some point which would invalidate a test. Using the Options dialog you can actually override the cookie:
which replaces the cookie for all requests with the cookie value specified here. You can capture a valid cookie from a manual HTTP request in your browser and then paste into the cookie field, to replace the existing Cookie with the new one that is now valid. Likewise you can easily replace the domain so if you captured urls on west-wind.com and now you want to test on localhost you can do that easily easily as well. You could even do something like capture on store.west-wind.com and then test on localhost/store which would also work.
Running Load Tests
Once you’ve created a Session you can specify the length of the test in seconds, and specify the number of simultaneous threads to run each session on. Sessions run through each of the URLs in the session sequentially by default. One option in the options list above is that you can also randomize the URLs so each thread runs requests in a different order. This avoids bunching up URLs initially when tests start as all threads run the same requests simultaneously which can sometimes skew the results of the first few minutes of a test.
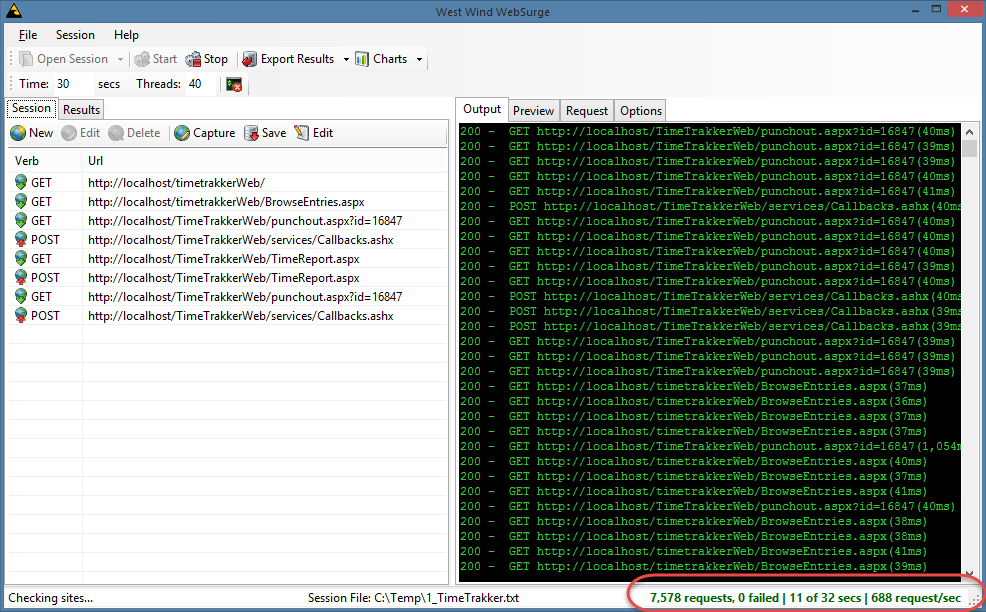
While sessions run some progress information is displayed:
By default there’s a live view of requests displayed in a Console-like window. On the bottom of the window there’s a running total summary that displays where you’re at in the test, how many requests have been processed and what the requests per second count is currently for all requests.
Note that for tests that run over a thousand requests a second it’s a good idea to turn off the console display. While the console display is nice to see that something is happening and also gives you slight idea what’s happening with actual requests, once a lot of requests are processed, this UI updating actually adds a lot of CPU overhead to the application which may cause the actual load generated to be reduced. If you are running a 1000 requests a second there’s not much to see anyway as requests roll by way too fast to see individual lines anyway. If you look on the options panel, there is a NoProgressEvents option that disables the console display. Note that the summary display is still updated approximately once a second so you can always tell that the test is still running.
Test Results
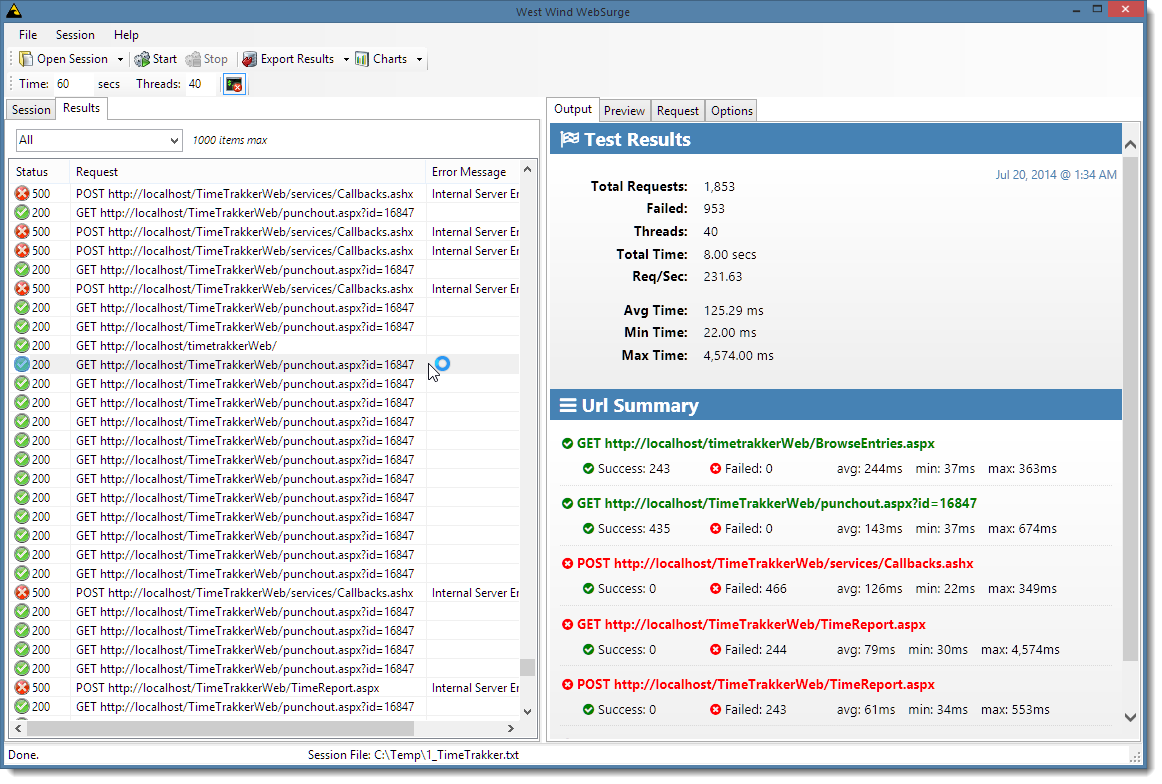
When the test is done you get a simple Results display:
On the right you get an overall summary as well as breakdown by each URL in the session. Both success and failures are highlighted so it’s easy to see what’s breaking in your load test. The report can be printed or you can also open the HTML document in your default Web Browser for printing to PDF or saving the HTML document to disk.
The list on the right shows you a partial list of the URLs that were fired so you can look in detail at the request and response data. The list can be filtered by success and failure requests. Each list is partial only (at the moment) and limited to a max of 1000 items in order to render reasonably quickly.
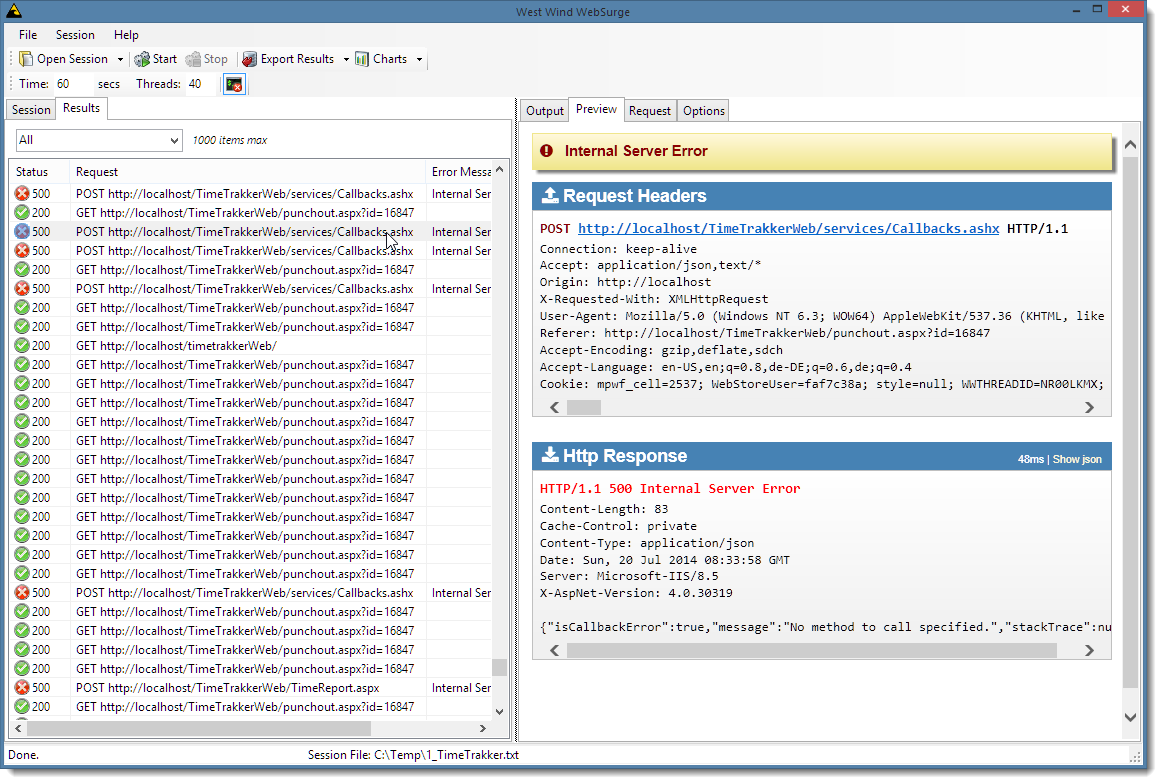
Each item in the list can be clicked to see the full request and response data:
This particularly useful for errors so you can quickly see and copy what request data was used and in the case of a GET request you can also just click the link to quickly jump to the page. For non-GET requests you can find the URL in the Session list, and use the context menu to Test the URL as configured including any HTTP content data to send.
You get to see the full HTTP request and response as well as a link in the Request header to go visit the actual page. Not so useful for a POST as above, but definitely useful for GET requests.
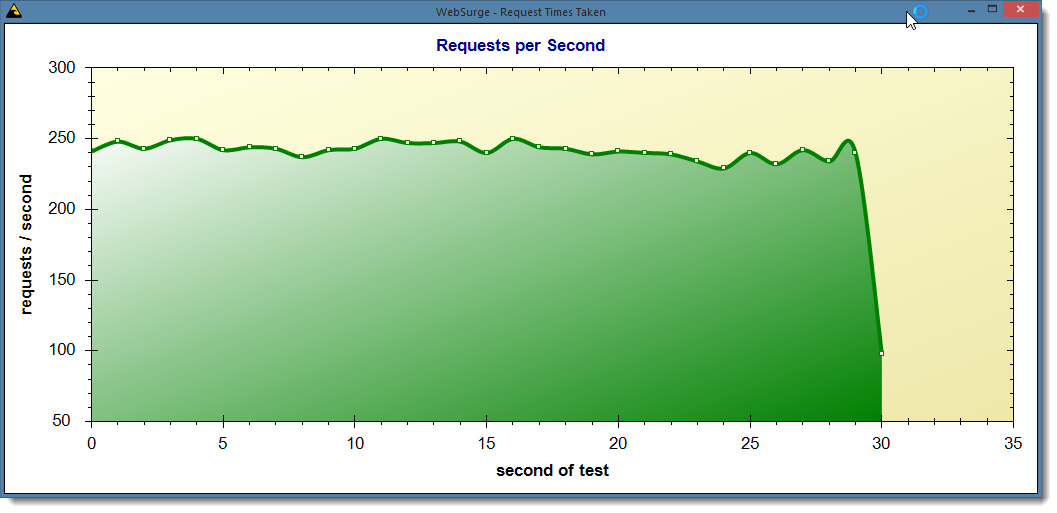
Finally you can also get a few charts. The most useful one is probably the Request per Second chart which can be accessed from the Charts menu or shortcut. Here’s what it looks like:
Results can also be exported to JSON, XML and HTML. Keep in mind that these files can get very large rather quickly though, so exports can end up taking a while to complete.
Command Line Interface
WebSurge runs with a small core load engine and this engine is plugged into the front end application I’ve shown so far.
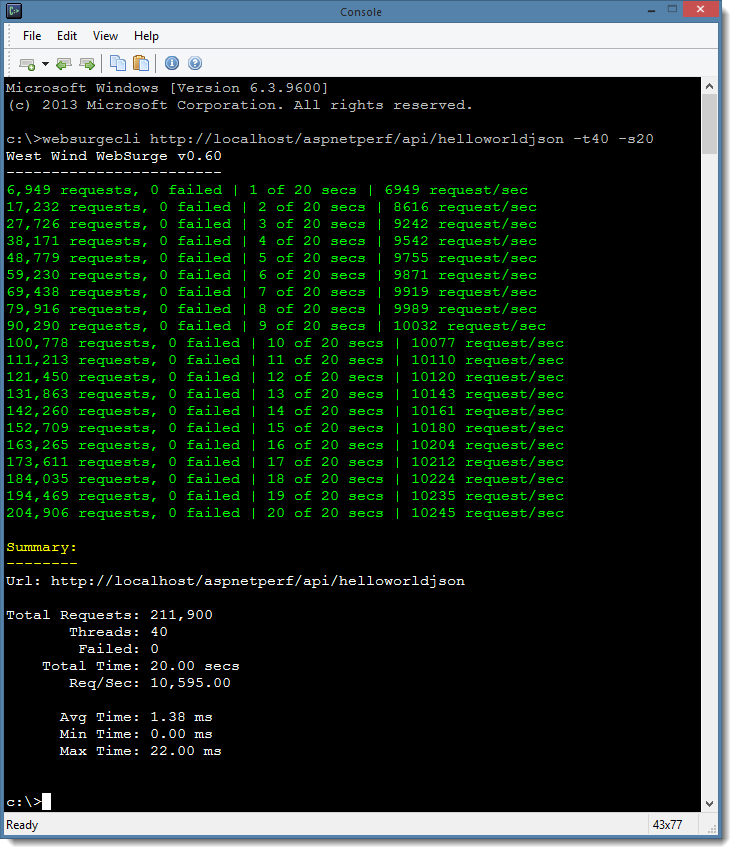
There’s also a command line interface available to run WebSurge from the Windows command prompt. Using the command line you can run tests for either an individual URL (similar to AB.exe for example) or a full Session file.
By default when it runs WebSurgeCli shows progress every second showing total request count, failures and the requests per second for the entire test. A silent option can turn off this progress display and display only the results.
The command line interface can be useful for build integration which allows checking for failures perhaps or hitting a specific requests per second count etc.
It’s also nice to use this as quick and dirty URL test facility similar to the way you’d use Apache Bench (ab.exe). Unlike ab.exe though, WebSurgeCli supports SSL and makes it much easier to create multi-URL tests using either manual editing or the WebSurge UI.
Current Status
Currently West Wind WebSurge is still in Beta status. I’m still adding small new features and tweaking the UI in an attempt to make it as easy and self-explanatory as possible to run. Documentation for the UI and specialty features is also still a work in progress.
I plan on open-sourcing this product, but it won’t be free. There’s a free version available that provides a limited number of threads and request URLs to run. A relatively low cost license removes the thread and request limitations. Pricing info can be found on the Web site – there’s an introductory price which is $99 at the moment which I think is reasonable compared to most other for pay solutions out there that are exorbitant by comparison…
The reason code is not available yet is – well, the UI portion of the app is a bit embarrassing in its current monolithic state. The UI started as a very simple interface originally that later got a lot more complex – yeah, that never happens, right? Unless there’s a lot of interest I don’t foresee re-writing the UI entirely (which would be ideal), but in the meantime at least some cleanup is required before I dare to publish it :-).
The code will likely be released with version 1.0.
I’m very interested in feedback. Do you think this could be useful to you and provide value over other tools you may or may not have used before? I hope so – it already has provided a ton of value for me and the work I do that made the development worthwhile at this point. You can leave a comment below, or for more extensive discussions you can post a message on the West Wind Message Board in the WebSurge section
Microsoft MVPs and Insiders get a free License
If you’re a Microsoft MVP or a Microsoft Insider you can get a full license for free. Send me a link to your current, official Microsoft profile and I’ll send you a not-for resale license. Send any messages to [email protected].
Resources
For more info on WebSurge and to download it to try it out, use the following links.
© West-Wind or respective owner
